
Impact
September CPG Economic Pulse
September 2020
Will Falling Temperatures Have a Cooling Effect on Economic Recovery?
After the double blow of a confirmed recession and higher numbers of COVID-19 cases reported this summer, the economy is proving resilient. The New York Fed’s Weekly Economic Activity Index — a composite of indicators — showed positive momentum from -5.3 percent on August 22 to -4.4 percent on August 29 and, most recently, to -4.3 percent on September 5.
As the economy grinds forward, the third quarter is expected to be stronger, with forecasted GDP growth around 20 percent, following the record-breaking decline in the second quarter, of 32 percent. But the outlook for the fourth quarter is murky, especially in light of fading fiscal support from the federal government and uncertainty about how falling temperatures and flu season will affect the COVID-19 caseload.
Looking at This Month’s Indicators
Spending Outpaces Overall Economic Growth: Consumer spending is outpacing the economy as a whole, driven by stimulus checks and expanded unemployment insurance benefits. This injection of cash gave consumers — especially those who had lost their jobs due to the pandemic — the ability to spend. Over the last three months there has been a remarkable rebound in retail sales: sales inched up 1.2 percent in July; increased 8 percent in June; and rose 8 percent in May. While consumer sentiment, as measured by the University of Michigan, is down from where it stood at the same time last year (89.8), this August it rose slightly to 74.1, from 72.5 in July.
CPG Sales Stay Strong as Americans Stay Home. CPG products continue their strong pace with year-over-year growth of 9.9 percent in July, identical to June’s 9.9 percent rate. On a monthly basis, CPG sales rose from June to July by 0.8 percent. Nearly all CPG categories showed month-over-month increases in sales. Minor reductions shown by a handful of sectors came on the heels of a month of significant growth.
- May-18
- Jun-18
- Jul-18
- Aug-18
- Sep-18
- Oct-18
- Nov-18
- Dec-18
- Jan-19
- Feb-19
- Mar-19
- Apr-19
- May-19
- Jun-19
- Jul-19
- Aug-19
- Sep-19
- Oct-19
- Nov-19
- Dec-19
- Jan-20
- Feb-20
- Mar-20
- Apr-20
- May-20
- Jun-20
- Jul-20
- CPG Purchases % Change Yr/Yr
- 4.9
- 3.2
- 3.8
- 3.4
- 2.8
- 3.1
- 3.7
- 0.6
- 3.4
- 1.8
- 2.8
- 3.1
- 2.4
- 4.0
- 4.2
- 4.0
- 3.2
- 3.1
- 1.9
- 4.1
- 1.7
- 3.3
- 20.8
- 5.9
- 9.9
- 9.9
- 9.9
- Disposable Personal Income % Change Yr/Yr
- 5.7
- 6.0
- 6.1
- 6.1
- 5.6
- 5.6
- 5.5
- 6.3
- 5.0
- 4.8
- 4.4
- 4.0
- 3.6
- 3.3
- 3.1
- 3.3
- 3.4
- 3.3
- 3.6
- 2.5
- 3.4
- 3.9
- 2.0
- 17.0
- 11.3
- 9.5
- 9.5
Jobs Grow and Anxiety Over Employment Income Lessens. The unemployment rate fell in August to 8.4 percent, with the addition of 1.4 million jobs. This improvement is 11.5 million jobs short of the pre-virus February level, but still bolsters confidence in the suitability of the recovery. Further, the most recent weekly Household Pulse Survey from the U.S. Census Bureau found that 25 percent of households expect to lose employment income in the next 4 weeks, down significantly from 39 percent at the end of April. A Consumer Brands survey of 1,000 American adults, conducted by Ipsos from September 14-16, found that 32 percent of respondents feel the economic worst is behind us, up significantly from last month’s 21 percent; another 38 percent feel the worst is still ahead, down from 51 percent last month.
Looking Ahead
Will Erosion of Government Support Hurt Future Spending? The numbers this month show a continued, cautious recovery. But these numbers are behind changes expected to show up more consequentially in the coming months. The $600 weekly unemployment benefits supplement expired in July, and the $300 weekly replacement ($400 for states that opt to kick in the additional $100 the administration requested) that President Trump announced in August has an uncertain future. Further, the Paycheck Protection Program, the federal government’s primary business relief effort, ended in August.
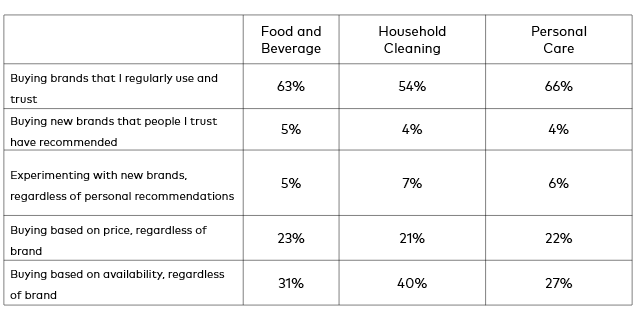
Will CPG Sales Continue Growth if Buying Patterns Shift? Spending has been made possible in many cases by government support programs. Without that infusion of cash, retail sales are likely to decline. CPG purchases are a potential outlier, as products like toilet paper and pantry staples are essentials, but the high volume buying experienced over the last six months may moderate. At this point, consumers are still predominantly buying the brands they use regularly and trust, with price and availability being a lesser consideration, according to a Consumer Brands survey. Consumers buying based on availability was strongest in the household cleaning segment, which has been in high demand.
Consumer Brands survey conducted by Ipsos of 1,000 American adults, September 14-16.
Will Congress Make a Deal in the Midst of Election Season? Consumer engagement and job growth in the next few months will be dependent on decreasing COVID-19 cases and a rapid and sizable response from Congress. But is such a response possible in the midst of a critical election season?
The economic future is inextricably linked to the direction the pandemic takes. The unanswered questions — from whether fall will bring a resurgence of COVID-19 to if the election will affect funding or even vaccine prospects — will influence what happens next.
About This Research
Consumer Brands’ CPG Economic Pulse analyzes the totality of the industry — food, beverage, household and personal care products — to offer a timely look at an industry that contributes $2 trillion to the U.S. economy and supports more than 20 million jobs.
Select information above is from a poll conducted by Ipsos that consisted of a total of 1,000 surveys, completed among a nationally representative sample of Americans, age 18 and older. The margin of error for the total sample is +/-3.3 percentage points at a 95% confidence level. The survey was conducted between September 14 and September 16, 2020.
The data in this report is released on a rolling calendar schedule. The figures presented are current at the time of publication and are subject to updates and revisions.
Methodology
Economic analysis provided by JEK Analytics.
The CPG purchases data is derived from U.S. Bureau of Economic Analysis reporting.
Estimates include food, nonalcoholic and alcoholic beverages for off-premises consumption; food purchased and consumed on farms; nonprescription drugs, household supplies and personal care purchases; and net purchase of goods by U.S. residents abroad.

The Economic Contributions of CPG
The CPG industry is the largest manufacturing employer in the United States. The food, beverage, household and personal care products that the industry makes have a positive impact on the lives of every American, every day.