
supply Chain
Supply Chain Dashboard
Charting the Crisis
The U.S. supply chain is in crisis. There are record numbers of ships waiting weeks to unload at ports, not enough trucks and drivers to move goods, skyrocketing costs for companies and consumers, and emerging input and product availability concerns — all underpinned by a labor shortage that is only growing worse. With half of Americans already reporting they have experienced recent shortages and more that expect to, the need to ease supply chain pressure has never been greater.
The numbers below reflect the challenges being felt at every link of the CPG supply chain and will be updated as new data becomes available.
6.3%
increase in CPG demand
3,165
increase in CPG jobs
CPG jobs decreased by 3,165 on a seasonally adjusted basis in February after an increase of 6,938 jobs in January
9%
Out of stocks
There is a 9% out-of-stock rate for CPG products, slightly higher for food and beverage products specifically at 11%.
5.7%
Increase in wholesale costs
Wholesale costs have decreased nearly 1% overall and increased 5.7% for food manufacturing over last year.
80 K
Drivers needed
80,000 truckers are needed and 13,200 added in October, helping chip away at openings after 13,000 were added in May.
5.8%
Wages
Industry manufacturing wages rose 5.8% above last year, outpacing the national nonfarm wage increase of 4.6%.
CPG Demand
Demand for CPG products has set records since the pandemic began. In fact, demand for consumer goods was up nearly 6.3% in May, compared to the same time last year when anxiety was high and stocking up on essentials was prevalent.

Key Facts
- CPG demand in May grew 6.3% over the year before.
- Demand for CPG products has continued to exceed the panic-buying highs of March 2020.
- With COVID not dictating everyday life the same way, current demand is reflective of a new normal.
Jobs
CPG needs a robust workforce to deliver essentials. But with sluggish growth in the industry and nearly 100,000 openings in the CPG industry, competition is fierce.
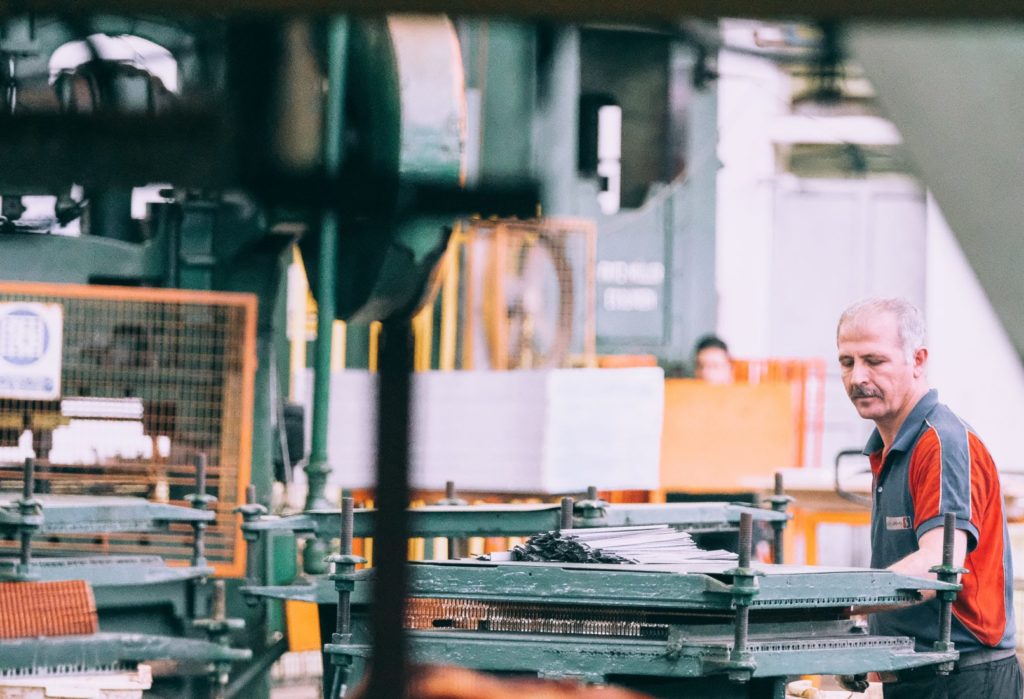
Key Facts
- The CPG industry has 98,350 unfilled jobs, and added around 3,165 in February.
- For manufacturing facility employees, wages have risen 5.8% over last year.
- There are more than 770,000 openings across the whole manufacturing sector.
Out-of-Stock Percentages
With greater demand and a strained supply chain, out-of-stock percentages are trending higher — for some categories nearly double the average.
The numbers on this page look at general categories and specific product types that are falling below average stock. For a more detailed breakdown, see IRI Worldwide’s CPG Supply Chain Index.
Key Facts
- Typical out-of-stock percentages run anywhere from 7-10% in normal times.
- Out-of-stocks are 9% for the total CPG industry. Within categories, out-of-stocks are 11% for food and beverages, 8% for household cleaning products and 5% for personal care.
Top Out-of-Stock Categories
These are the product categories where out-of-stock percentages are above normal.
| 1 | Refrigerated Baked Goods | 14% | |
| 2 | Sports and Energy Drinks | 15% | |
| 3 | Frozen Baked Goods | 14% | |
| 4 | Bakery | 13% | |
| 5 | Cookies and Crackers | 13% | |
| 6 | Snacks | 12% | |
| 7 | Juices | 12% | |
| 8 | Carbonated Beverages | 12% | |
| 9 | Water | 12% | |
| 10 | Refrigerated Meals | 11% | |
| 11 | Frozen Snacks | 10% | |
| 12 | Laundry | 7% |
Wholesale Costs
There have been several months of significant increases (and all-time records set) in the Producer Price Index, which tracks the wholesale cost of commodities.
Key Facts
- The Producer Price Index decreased 1% in February over the year before.
- The increase in key commodities for the CPG industry is much higher in many cases. For examples of raw ingredients and materials that are up significantly, see the list below.
- With big increases in the cost to make and ship goods, consumer prices are also rising, though at a slower pace. The Consumer Price Index rose 6% in February over the year before.
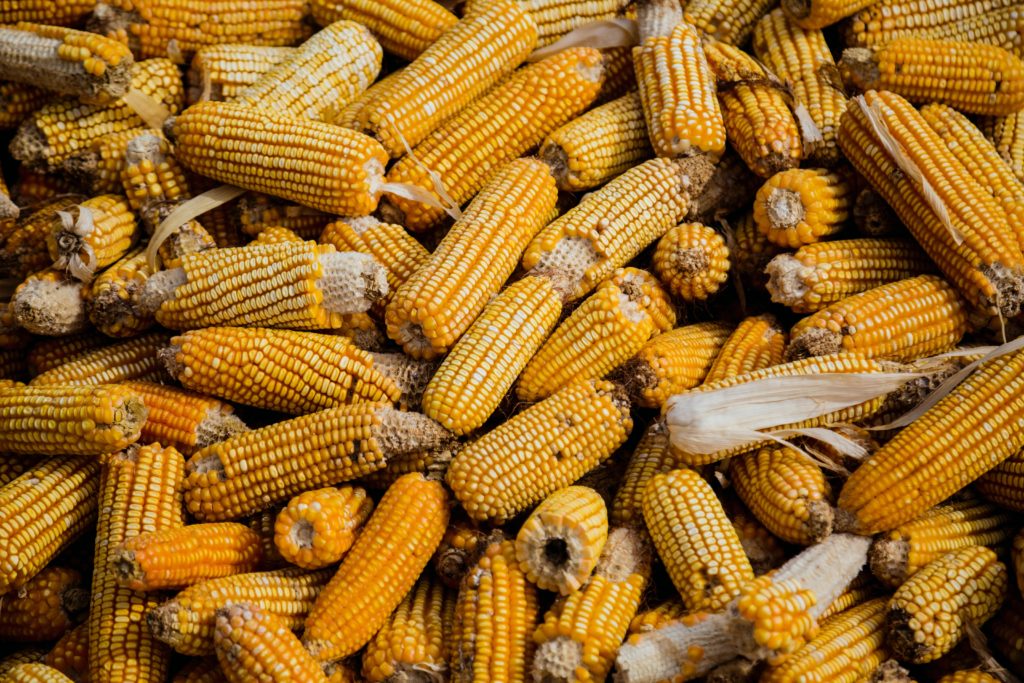
Commodity Costs Watchlist
Here are the top ten most expensive ingredients and materials commonly used by the consumer goods industry, in percentage increase from December 2021 to January 2023.
| 1 | Eggs | 38% | |
| 2 | Pasta | 27% | |
| 3 | Fresh Vegetables | 26% | |
| 4 | Turkeys | 20% | |
| 5 | Soaps and Detergents | 17% | |
| 6 | Soft Drinks | 15% | |
| 7 | Pet Food | 12% | |
| 8 | Frozen Foods | 11% | |
| 9 | Corn | 10% | |
| 10 | Diesel | 5% |
Trucking
The CPG industry accounts for one-fifth of all freight shipping in the United States. And the vast majority (approximately 90%) of CPG products are sourced and made in America — meaning it takes a lot of trucks and drivers to transport ingredients and materials to make products and to ship finished goods to stores.
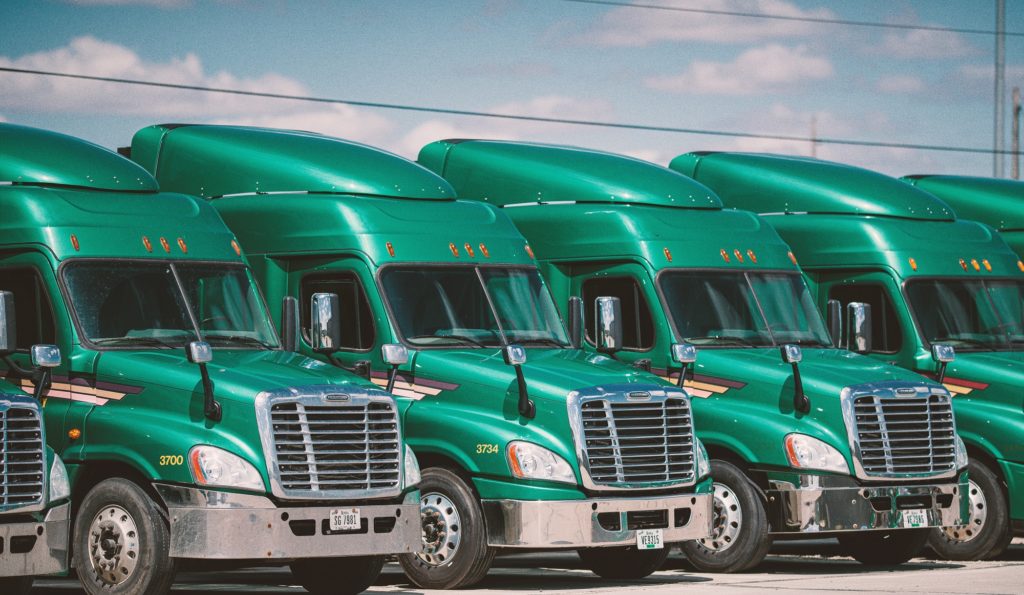
Key Facts
- For every one truck available, there are as many as 16 shipments waiting to be transported.
- The American Trucking Associations estimates 80,000 truckers are needed. 13,200 jobs were added in October, even as truckers’ earnings have increased a rate five times their historical average.
- Coyote Logistics reported a 48% increase in spot loads, or one-off non-contract shipments, since the start of the pandemic. The company also tracked a 40% decrease in available trucks offered by carriers.
- Diesel fuel costs are up, an increase that will cost upwards of $3 billion more to supply this year.
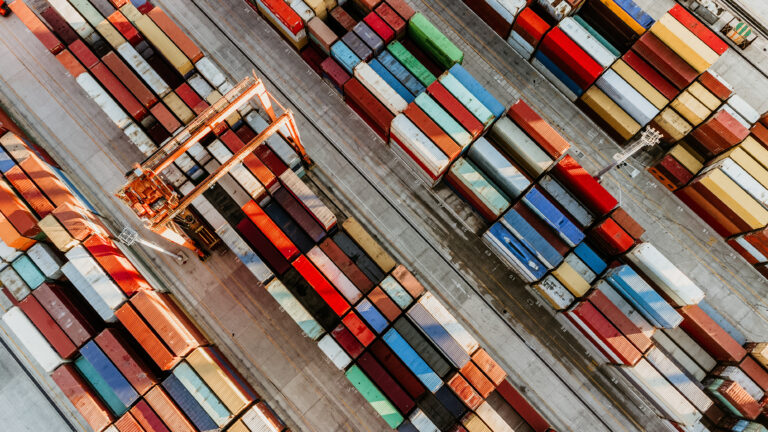
Ports
While a large part of the consumer goods industry in the United States operates and sources domestically, port congestion still means trouble for business. And when containers are offloaded, there need to be trucks available to take them to their next destination — ratcheting up competition for drivers and vehicles that are already in short supply.
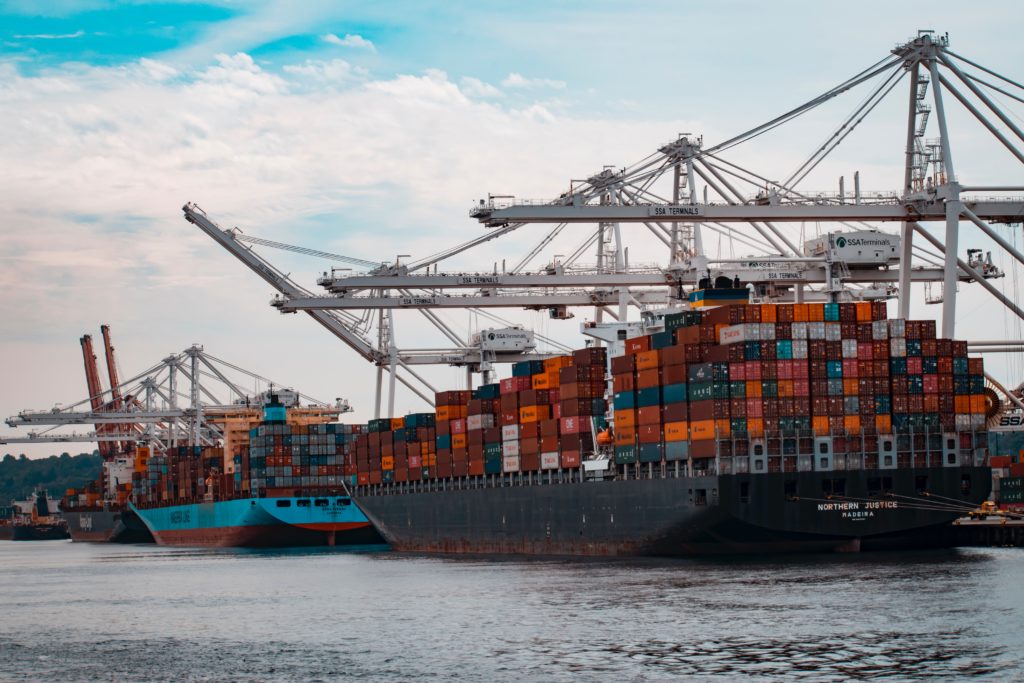
Key Facts
- As many as 108 container ships are stuck at Southern California ports, the ports of entry for more than 40% of the nation’s ocean shipments. Normally there is no more than one ship waiting.
- In September, Goldman Sachs estimated there was $24 billion in goods adrift on the California coastline.
-
Freightos reported the median cost of shipping a standard metal container from China to the West Coast was $20,586 in September — almost double what it cost in July and 700% higher than it cost a year ago.
How Many Containers Can a Cargo Ship Hold?
Ship sizes vary, but each of them carry thousands of containers with ingredients, materials or finished goods ready to ship across the country. Carrier Asiana reported that most cargo ships hold an estimated 10,000-21,000 TEUs (containers). Type a number into the box below to see how many, on average, are in the current traffic jams. See here for a full breakdown of California’s port traffic.
Container Ships
Number of boats waiting in a port
Containers
Estimated total cargo containers
Rising Concerns
A recent Consumer Brands/Ipsos poll showed Americans are feeling the pinch of grocery inflation, have shifted where they attribute blame and see solving supply chain challenges as a means of easing pricing pressures.
Key Stats
- 72% of Americans said that increased grocery prices were having a very significant (34%) or somewhat significant (38%) impact on their household budgets.
- A growing number of Americans blame supply chain costs and constraints as the primary driver of inflation.
Shortage Concerns
Below are the percent of Americans who say they’re worried about access to categories of products. Access to CPG products was the top concern.
| 1 | Food and beverage products | 55% | |
| 2 | Cleaning and personal care products | 44% | |
| 3 | Holiday food items (i.e. turkeys) | 34% | |
| 4 | Electronics | 24% | |
| 5 | Apparel and shoes | 21% | |
| 6 | Toys | 15% |
Read More
Press Release
Consumer Brands Issues Statement on Section 232 Inclusions Process
Blog
On Trade: How Renewing the USMCA Agreement Supports American Manufacturing
Press Release
Consumer Brands Issues Statement on the Trump Administration’s Executive Order Modifying the Scope of Reciprocal Tariffs